What Was Tested
The experiment compared the stored original CDP2v2 executable against the current workload-aware allocator build.
- Original executable:
executables/codex-cdp2v2/b6b2569/GPUPerft_CDP2.exe - Current executable:
executables/master/2e9364f/GPUPerft_CDP2.exe - Standard validation corpus: all 18 SF18-backed validation positions at
d9, plus start positiond10andd11 - Main result table:
gpuperft-cdp2v2-workload-allocator-20260526.tsv - Canonical graph:
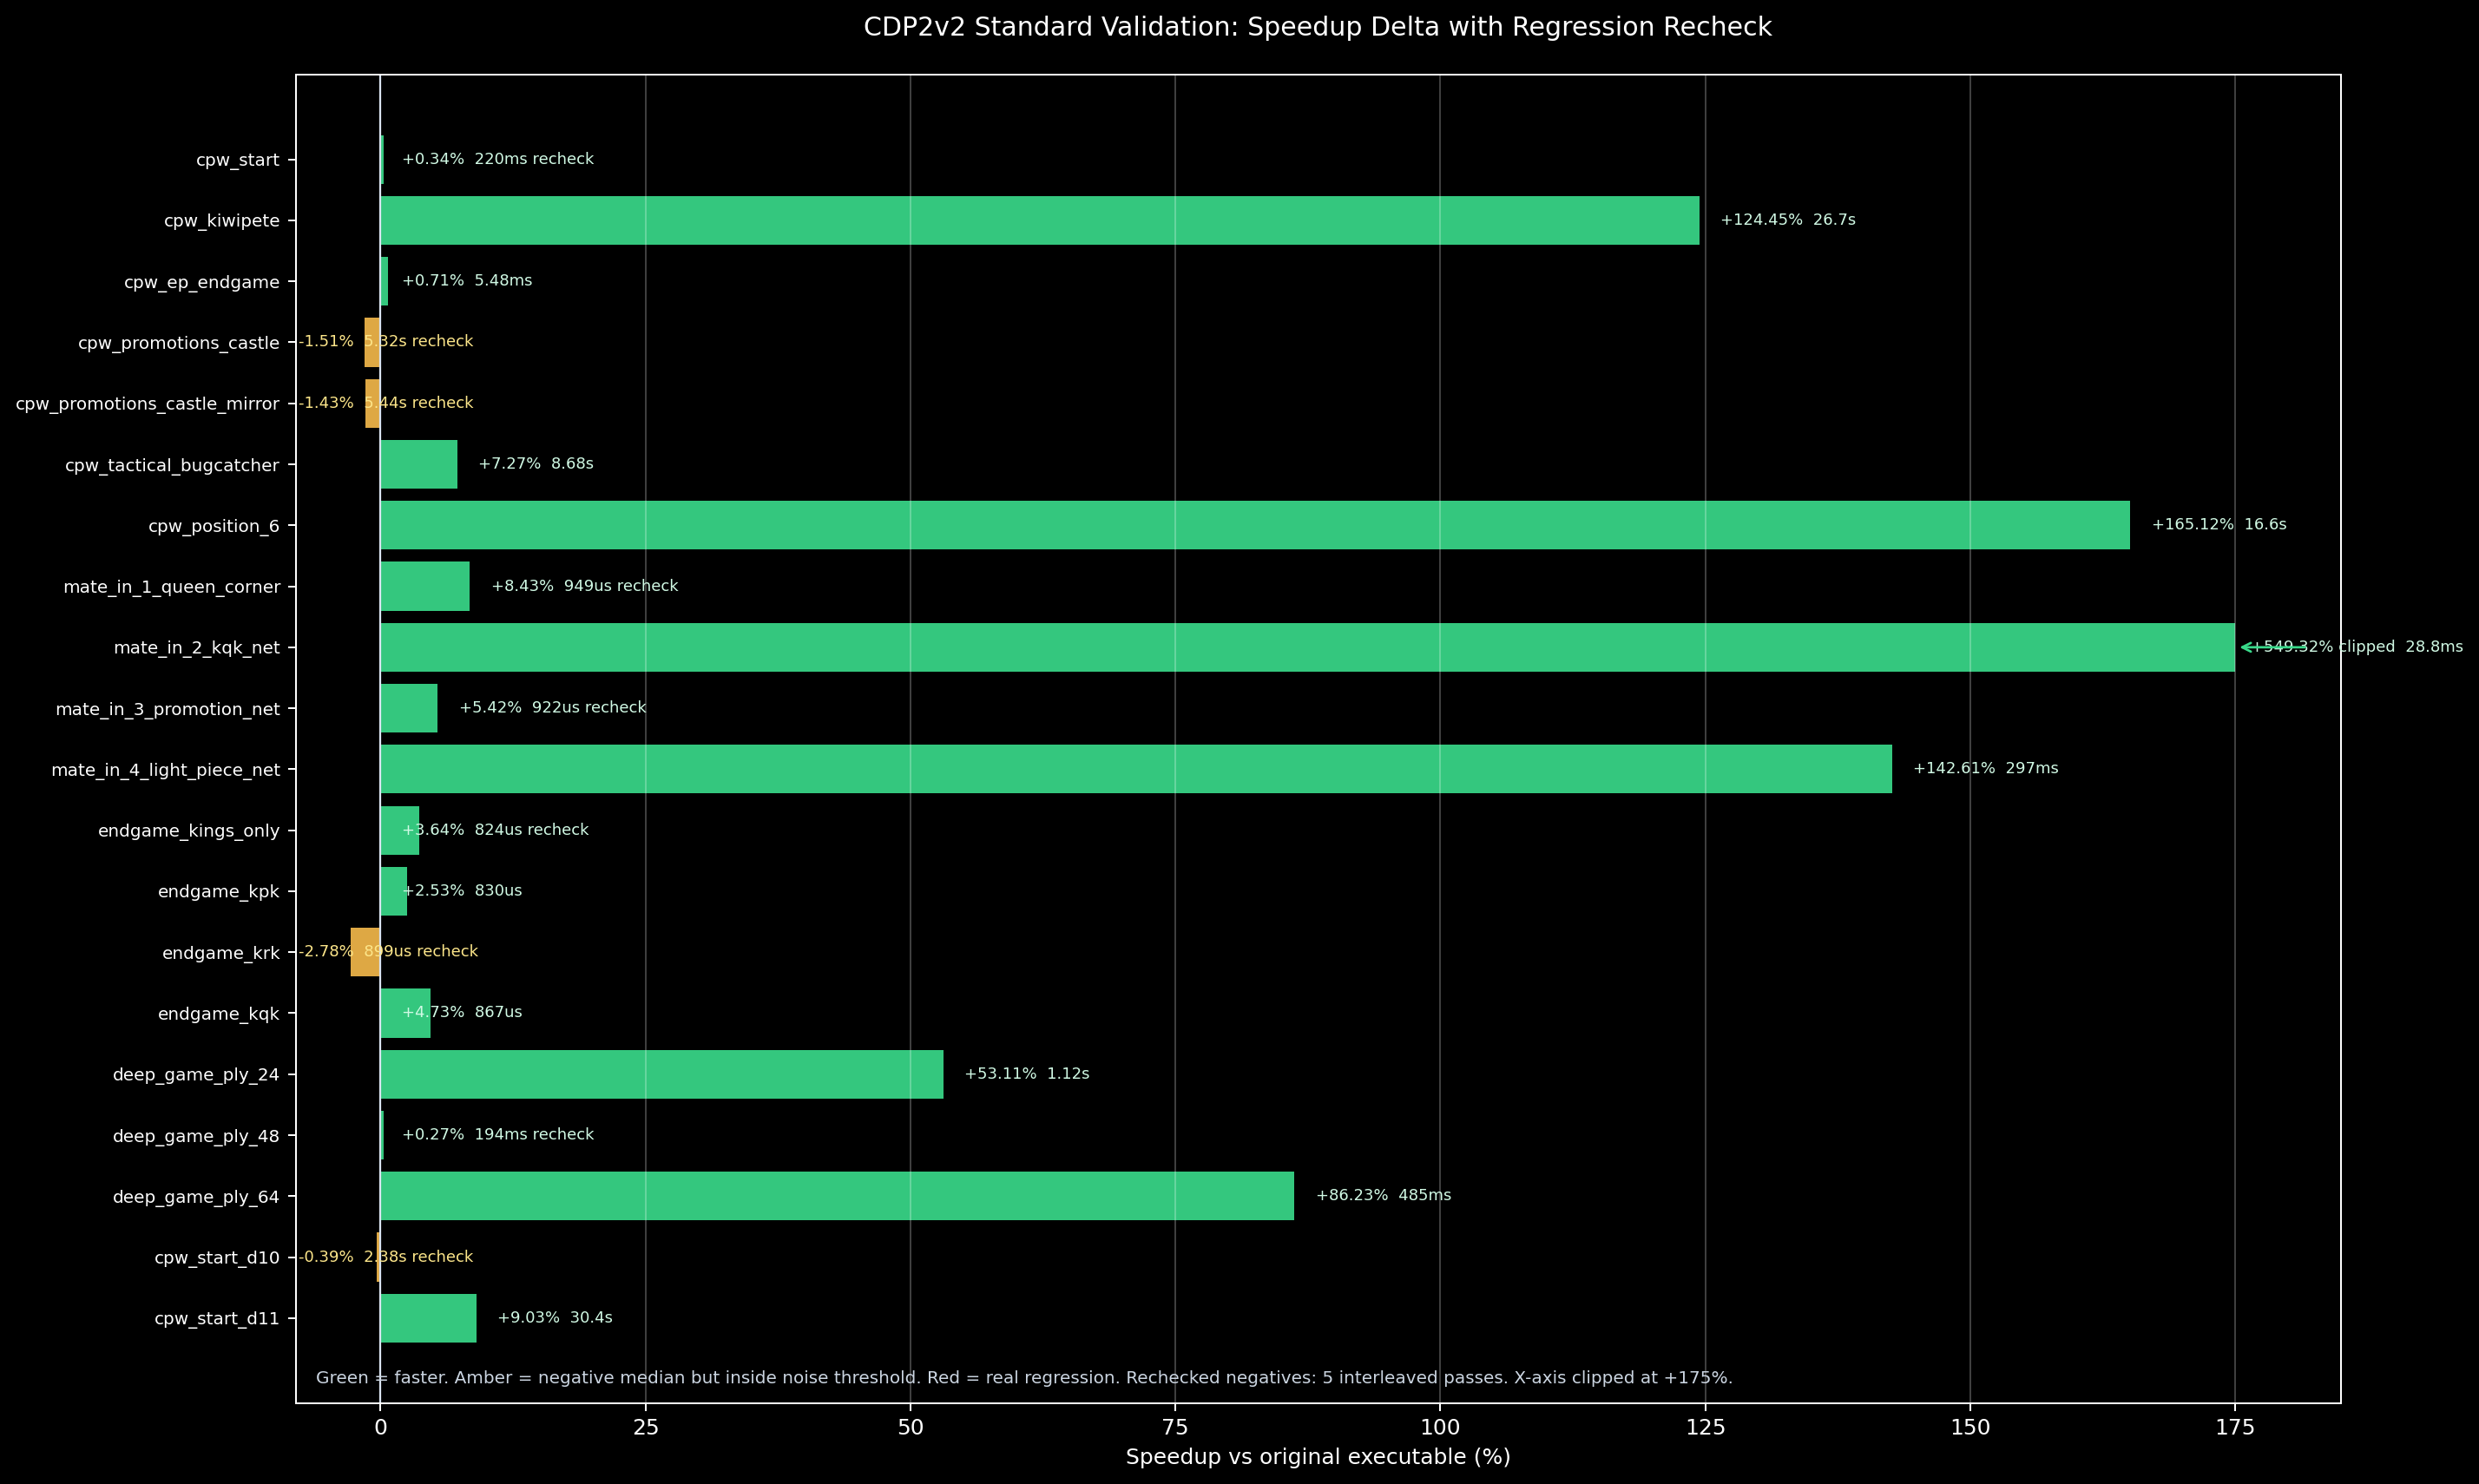
graph_standard_validation_speedup_delta_dark.png
Result Summary
Across the full standard corpus:
- Original total wall time:
163.456s - Current total wall time:
97.935s - Aggregate wall-time speedup:
+66.90% - Arithmetic mean per-position speedup:
+57.86% - Geometric mean per-position speedup:
+34.56% - Median per-position speedup:
+5.08% - Real regressions after recheck:
0
The aggregate wall-time number is the most useful answer to “how much faster is the suite overall.” The arithmetic average is inflated by outliers, especially sparse positions where the old executable chose a poor launch shape.
Regression Recheck
The first chart showed some negative rows, so every first-pass negative row was rerun with five interleaved original/current passes. A regression was considered real only if the current median was slower than the original median by more than:
max(2% of baseline median, 3 * median absolute deviation, 20 microseconds)
After that recheck, there were no real regressions. Four negative medians remain in the standard graph, but all are inside the noise threshold:
| Position | Depth | Median Delta | Speedup | Threshold |
|---|---|---|---|---|
cpw_promotions_castle |
9 | +0.080253s |
-1.51% |
0.104816s |
cpw_promotions_castle_mirror |
9 | +0.077984s |
-1.43% |
0.107176s |
endgame_krk |
9 | +0.000025s |
-2.78% |
0.000210s |
cpw_start_d10 |
10 | +0.009332s |
-0.39% |
0.047503s |
Why The Biggest Speedup Is So Large
The largest outlier is mate_in_2_kqk_net d9, at +549.32%. That should not be read as “memory allocation made identical work six times faster.”
The real reason is execution shape:
- Original:
Allocated BFS buffer: 10760 MB,Launch depth: 6,Perft(09): 0.186990s - Current:
Allocated BFS buffer: 15249 MB,Launch depth: 7,Perft(09): about 0.0289s
That one-ply launch-depth shift matters enormously for this sparse KQK position. The old run fell into a poor low-frontier/host-continuation regime. In the original output, Perft(07) alone took 13.080ms; in the current output, the same depth took about 0.617ms.
The allocator win is therefore not magic memory speed. It is a planning win: allocate enough BFS/frontier memory to let the planner choose the correct GPU execution shape, while preserving TT capacity when a larger arena does not change the launch shape.
Canonical Graph
Only one graph is staged with this review draft to avoid stale subset charts contradicting the corrected result.